
Match AGOL Basemaps to a Company Brand
- Andy Bohnhoff

- Jul 21, 2021
- 4 min read
Updated: Oct 2, 2021
ArcGIS Online allows free access to dozens of different basemaps ranging from a simple street map to colored pencil symbology. But did you know you can edit each of these basemaps to fit your company's needs? Below is a quick tutorial on how I matched an AGOL basemap to the Platte River Analytics' branding guide.


Branding Guide
The first step is to have a good branding guide. Most typical branding guides include items like font type, font examples, color swatches, logo colors and alternate logos. I used Adobe Illustrator to create mine, but you can easily find a freelancer to put one together for your company. If you are doing this work for a client, and they already have an updated branding guide, then you are one step ahead.
For this particular project, the most important feature of a branding guide is going to be the color swatches. Typically, you will want 3-4 color swatches and their HEX or RGB codes. This is a simple but very useful website to determine color values:
Keep a note of at least 3 color values for this project.
Choosing a Basemap
AGOL gives developers access to a platform called "ArcGIS Vector Tile Style Editor" which is a fancy name for "Basemap Editor". After signing in to your org account, the first step is to select the basemap that you wish to edit.

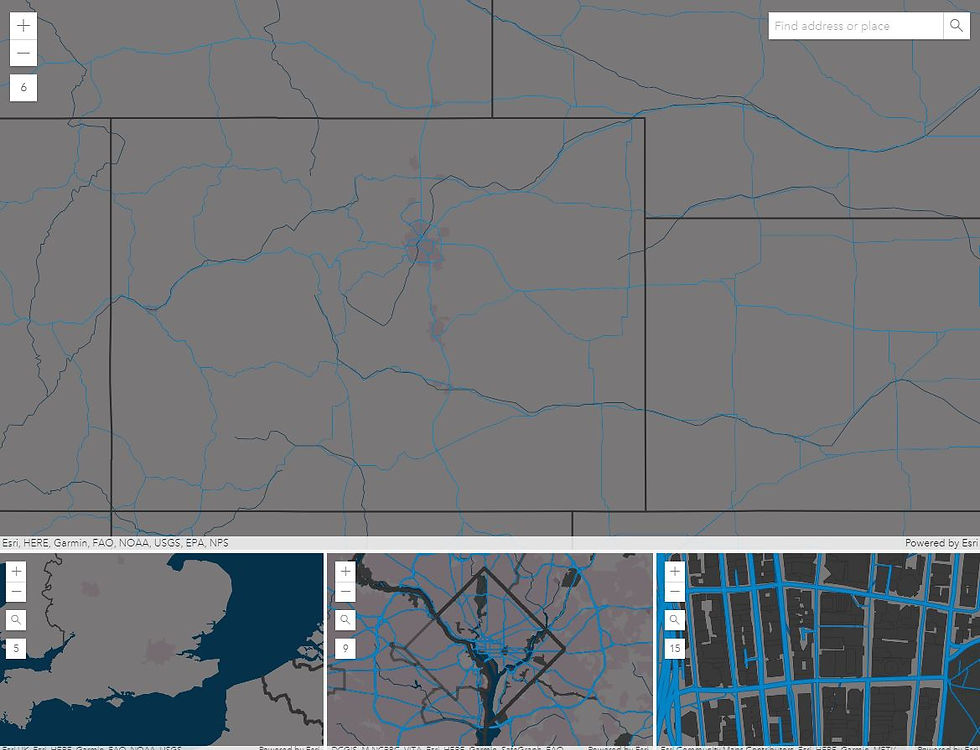
I particularly enjoy the darker basemaps, so I am going to select the Dark Gray Canvas Basemap, which can be found in the "All ESRI Basemaps" ribbon. After selecting your basemap, you will see your editing options to the left and then 4 different views of the basemap to the right.
What's extremely handy with the 4 views is you can get a birds eye view of the changes you are making without having to zoom in and out. The main map is at a world level and then each smaller map shows you zoom levels down to a street view.

The main editing toolbar allows you to make wholesale edits, such as editing all of the roads or all of the water features at once. As you can see with the dark gray canvas basemap, the colors range from a dark gray to an even darker gray. Now I am going to start editing some of my features to match the Platte River Analytics branding guide.
A few changes I will be looking to make is to match the water and roads with the blues/grays from our branding guide and then also make edits to the labeling of various features.
Editing the Basemap to Match a Branding Guide

Keeping my branding guide on the other screen, I am going to start editing a few of the layers using the quick edit window. I matched the land, water and roads to the dark gray, dark blue and light blue from my branding guide. I like the look of the dark gray basemap, so I am going to leave a majority of the items a darker color. The quick edit window makes it easy to quickly change the color values using the HEX codes. As you change the colors, the basemaps to the right are also updating. You can now see how having the smaller basemap views is very handy to see the the changes affect different views.
Now that some of the larger values are changed, I want to change some individual items. By clicking on the "Edit Layer Styles" icon, I can go in and change very minute details like 4 wheel drive roads, parking lots or urban areas.

I noticed that the major roads like US Interstates don't turn on until I am zoomed in to the state level. I want to edit the visibility range on major roads to turn on at the country level. There are 2 ways to edit this detail: I can find the layer in the menu or I can use the cursor in the basemap on the right and click on the item that I want to edit. This is a nice feature for quickly editing different items in the map.
Currently, the major roads have a visibility range of 9 to 22 but I want to edit that so the major roads turn on at a higher level.

The little arrow just under the word "Range" shows me the zoom level that my basemap is currently residing, which is at a country level. I am going to change the 9 to a 5 and now the major roads will turn on at more of a zoomed out level.
All that is left is to save the basemap to your gallery and then add it to your favorite AGOL maps and apps!
Andy Bohnhoff
Platte River Analytics
About Us:
Platte River Analytics aims to promote business development with the utilization of location analytics and spatial business intelligence. Platte River Analytics assists companies with finding optimal locations in retail site selection and helping to solve important business questions utilizing location data and intelligence.
Utilizing spatial intelligence, we assist small businesses with securing, storing and analyzing boundless amounts of data, establishing interactive maps and dashboards analysis, and extracting business insights.
If you are looking to convert your location intelligence into a competitive edge, send us a message today for more details and examples.


Comments